CONTACT: Timothy Smeeding, smeeding@lafollette.wisc.edu, (608) 890-1317
MADISON—The latest Wisconsin poverty analysis using a state-specific poverty measure devised by University of Wisconsin–Madison researchers found mixed results in our efforts to alleviate poverty and promote self-sufficiency in our state .
The statewide overall poverty rate using the Wisconsin Poverty Measure (WPM) dropped from 10.8 percent in 2016 to 10.2 percent in 2017, a significant drop, but still above the 2015 rate of 9.7 percent. This suggests that progress against poverty in Wisconsin since 2010 has been limited and that we are treading water at this point.
Child poverty fell using the WPM, from 12.0 percent to 10.1 percent during the same time period, but elder poverty rose from 9.0 percent to 9.5 percent.
These findings were released today in the Eleventh Annual Wisconsin Poverty Report by Timothy Smeeding, Lee Rainwater Distinguished Professor of Public Affairs and Economics at the La Follette School of Public Affairs and Affiliate and former Director of the Institute for Research on Poverty (IRP), in collaboration with IRP Senior Programmer Analyst Katherine Thornton.
Smeeding notes, “These findings suggest that the economy is not benefitting workers and families evenly across our state. I’ve been conducting this study for 11 years now and I have to say, after more than eight years of nationwide recovery from the end of the Great Recession through 2017, we should see better poverty outcomes.”
The WPM results suggest that the drop in child poverty is due to higher earnings by poor parents, despite real wages that are lower now than in 2010. The drop also reflects the broader range of tax credits and benefits for families with children; and the fact that the WPM counts the income of unmarried partners as contributing to family resources.
The increase in elder poverty is in large part due to increasing out-of-pocket medical expenses, considered in the WPM but not the official poverty measure. Insurance premiums, copayments for medical services, prescription and over-the-counter drugs, and uninsured medical costs are expenses that present a significant financial challenge for the low-income elderly.
As explained in the report and shown in the table below, the comparison between the two measures provides evidence that public programs such as SNAP food assistance significantly reduce economic disadvantage for many Wisconsin families with children.
Wisconsin Poverty Measure (WPM) poverty versus official poverty measure (OPM) poverty
| Poverty measure | Family (Also called “resource-sharing unit”) |
Thresholds | Income | 2017 Poverty rates | ||
|---|---|---|---|---|---|---|
| Overall | Child | Elder | ||||
| Wisconsin Poverty Measure (WPM) | All persons who share the same residence & are assumed to share income & consumption (including foster children & unmarried cohabiting partners) | $27,241 (2-child, 2-adult family); includes: – Bottom 33 percent of average national cost of food, clothing, shelter, & utilities – Adjusted for cost-of-living differences – Allowance for childcare, work expenses, & out-of-pocket medical expenses |
– Earnings less taxes paid – Refundable tax credits, including EITC and ACTC – Noncash antipoverty program benefits including food assistance (SNAP) & housing subsidies |
10.2% | 10.1% | 9.5% |
| Official poverty measure
(OPM) |
“Family” defined as married couples, their children, and other blood relatives only | $25,094 (2-child, 2-adult family); includes: – Three times cost of minimally adequate diet in early 1960s adjusted annually for inflation – No adjustment for cost-of-living differences – No allowance for childcare, work expenses, or out-of-pocket medical expenses |
– Pretax cash income only (i.e., does not count antipoverty program benefits therefore does not reflect the antipoverty effects of the social safety net) | 10.9% | 14.2% | 7.1% |
| Source: Institute for Research on Poverty tabulations using 2017 American Community Survey public use data. | ||||||
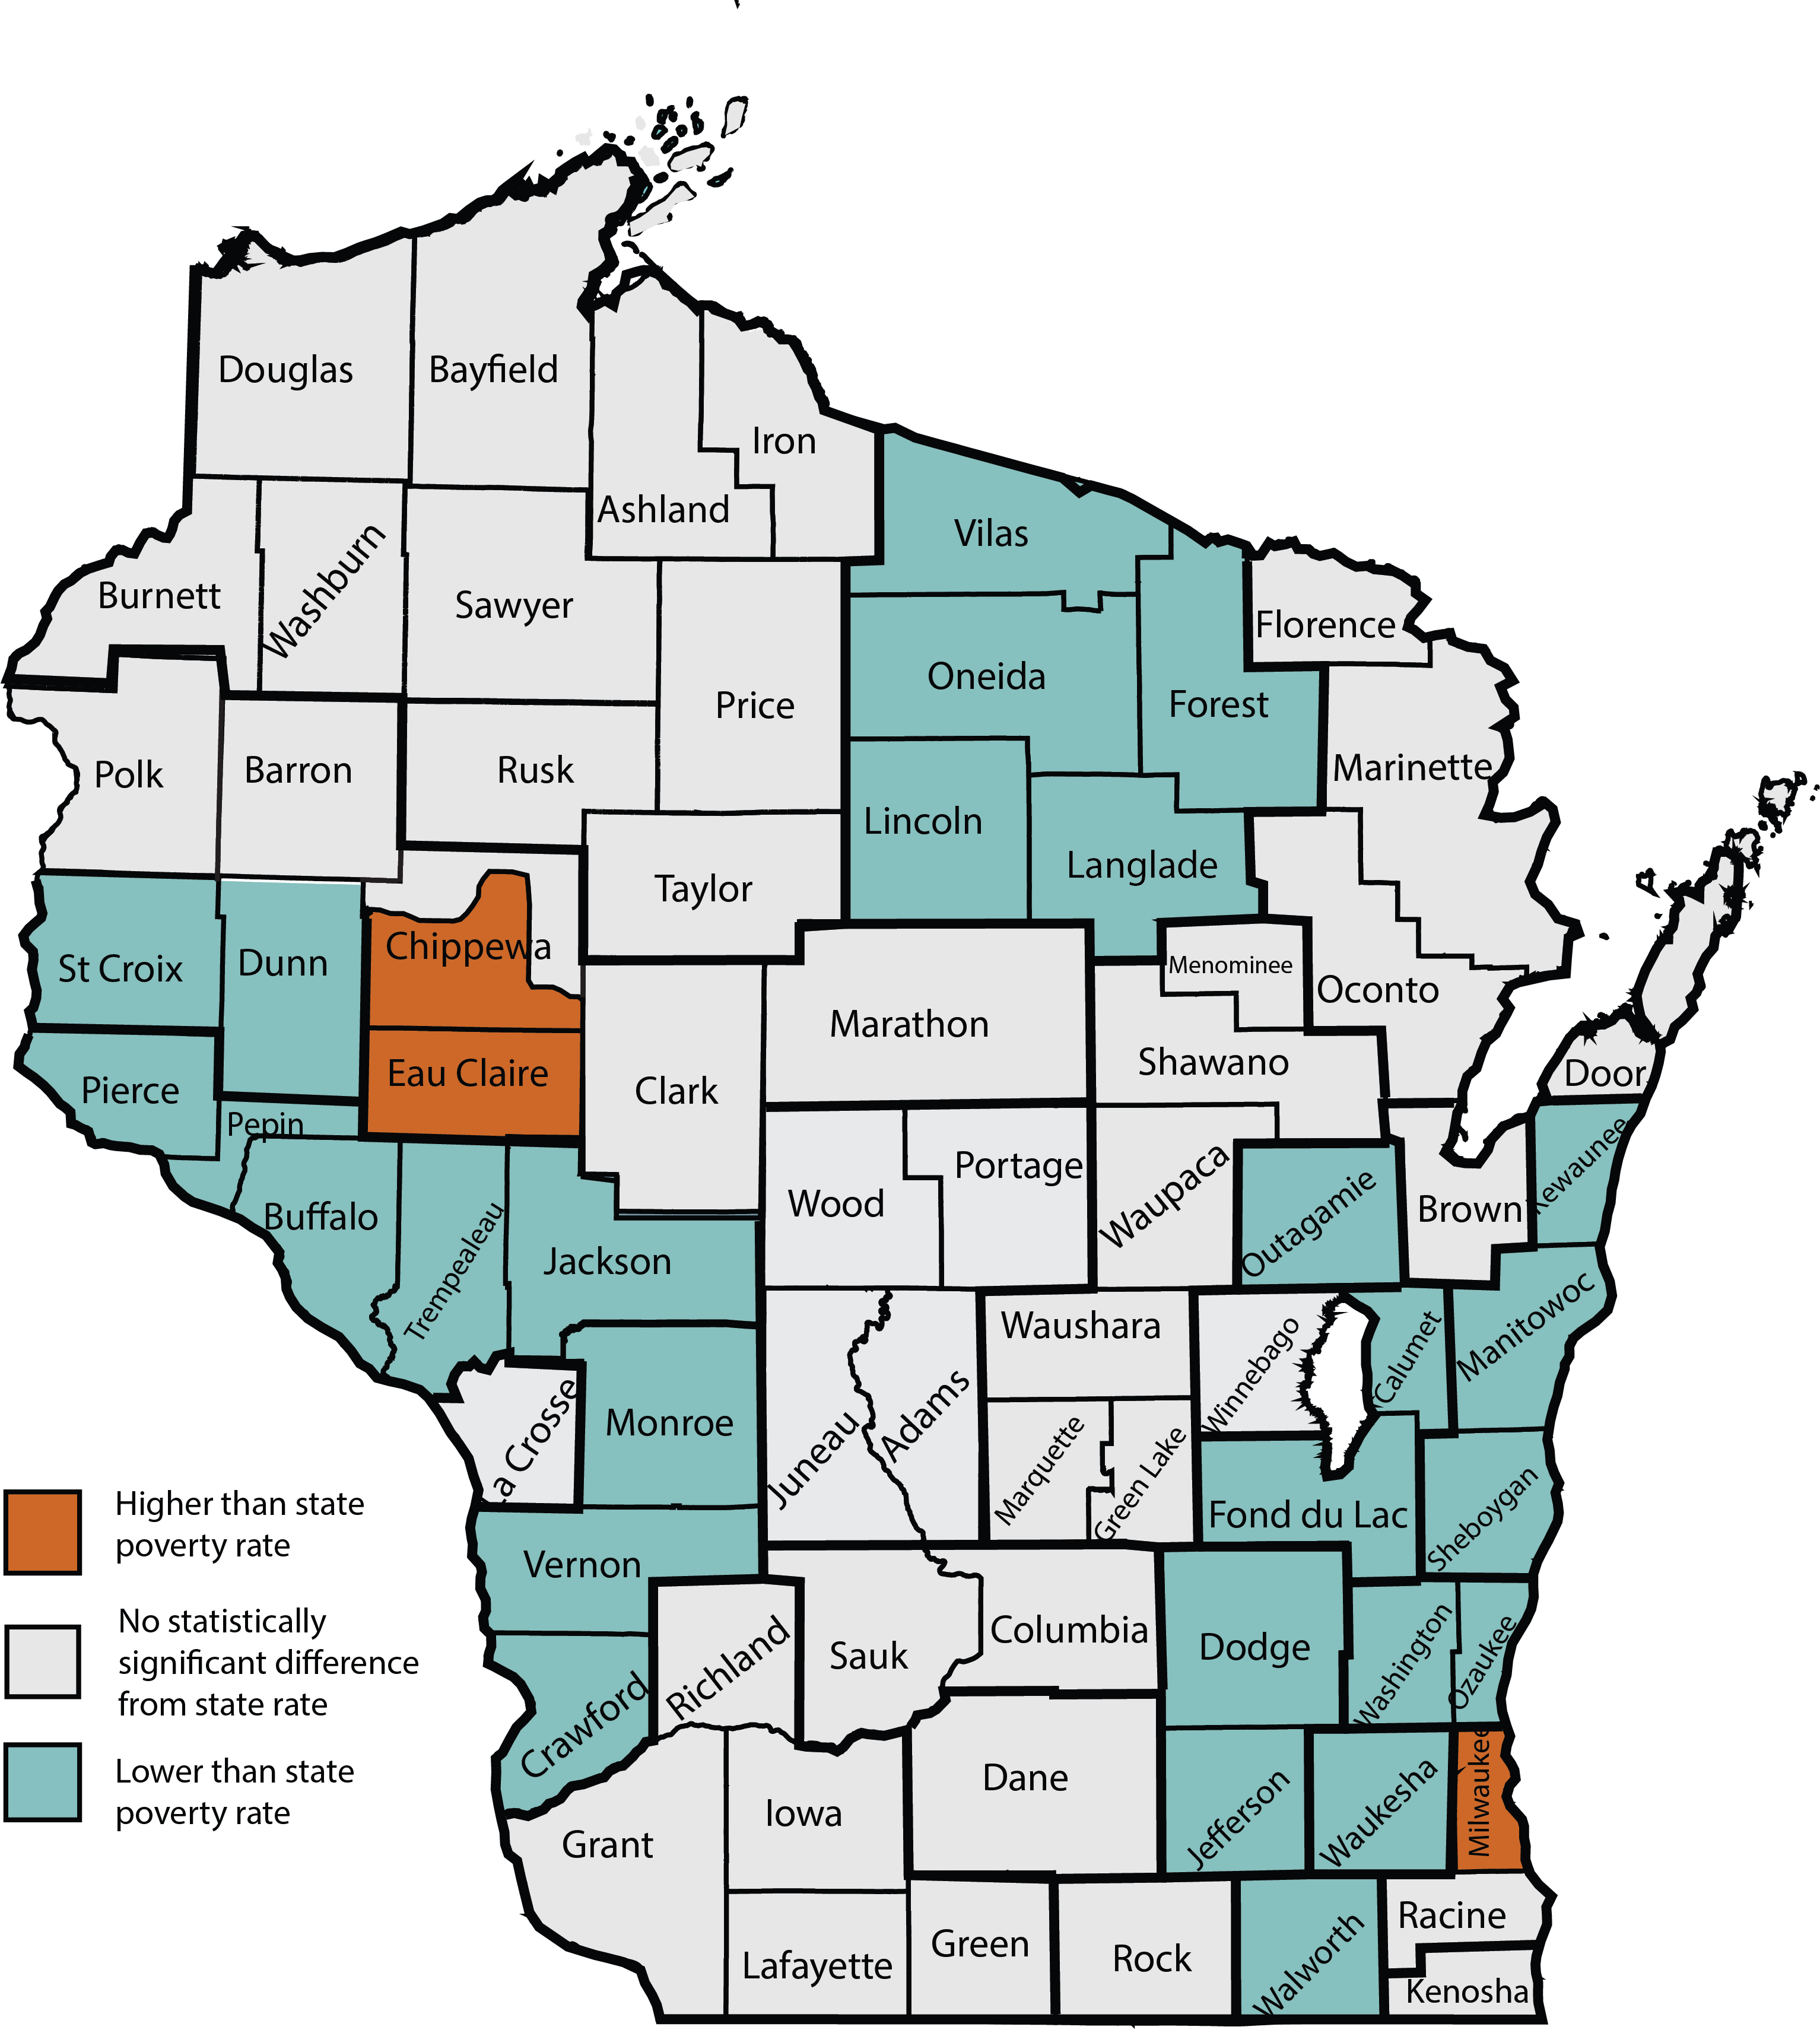
The WPM rises to 17.2 percent in Milwaukee County and 14.4 percent in the area made up of Eau Claire and south Chippewa counties. These are the only places with rates significantly higher than the state average of 10.2 percent.To understand how poverty varies across Wisconsin, the report estimates poverty for a number of counties and sub-state areas (see map below). Estimates for poverty rates are as low as 3.6 percent in Washington and Ozaukee counties and 4.2 percent in Waukesha County.

Source: Institute for Research on Poverty tabulations using 2017 American Community Survey public use data.
The report suggests that if we are to make progress against poverty for the non-elderly, work alone at today’s wages is not enough. Greater work supports and income supports are also needed. We need to maintain and improve the safety net, reduce childcare costs, and raise Wisconsin’s minimum wage to more than $10 per hour if we are to break out of the poverty rut we are in and share the benefits of the recovery more widely with the most disadvantaged among us.
Brad Paul, Executive Director of the Wisconsin Community Action Program Association (WISCAP), which supports the Wisconsin Poverty Report, commented, “WISCAP is proud to support the Wisconsin Poverty Project, which shares University of Wisconsin expertise in this important way so we can all have an accurate accounting of poverty among Wisconsinites—and therefore be better equipped to fight it.”
###
—Deborah Johnson, deborah.johnson@wisc.edu, (608) 262-7779