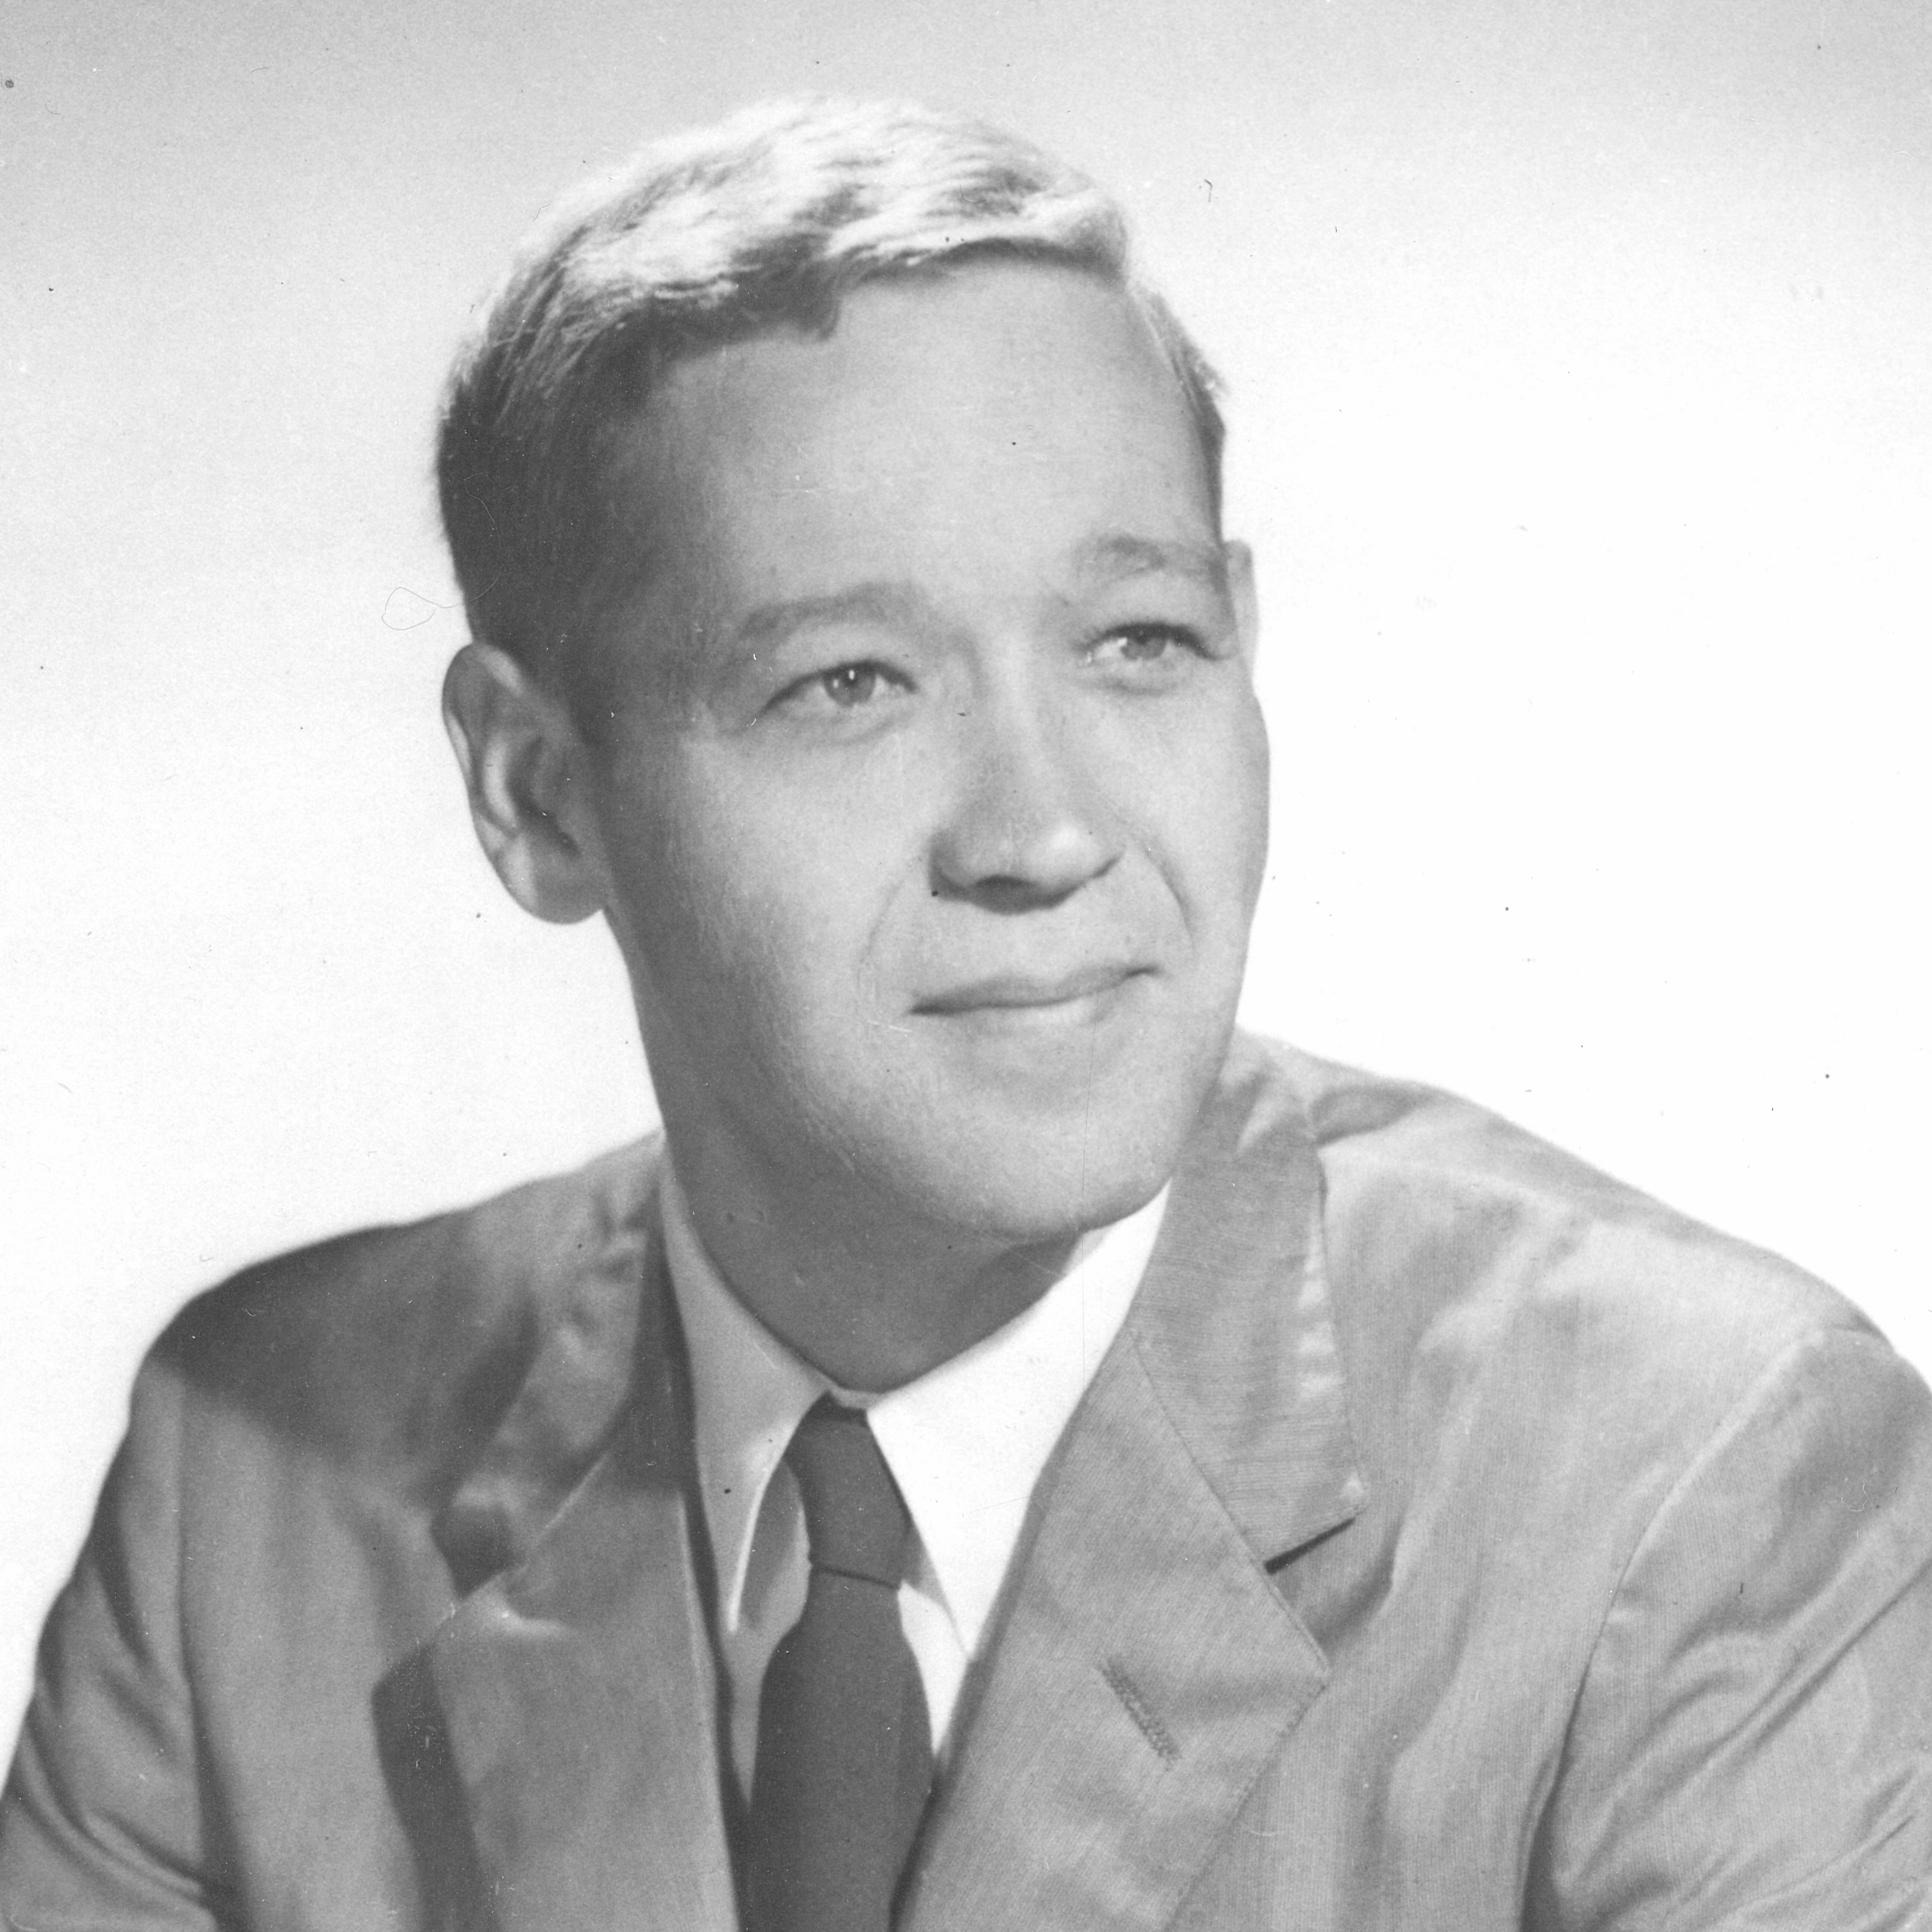
This annual lecture honors the life’s work of Robert J. Lampman, a professor of economics at UW–Madison for over 30 years and IRP’s founder and guiding spirit. The lecture features eminent poverty scholars discussing their research on the topics to which Lampman devoted his intellectual career: poverty, the distribution of income and wealth, and related public policy. The lecture is held on the UW-Madison campus and is open to the public. Videos and transcripts of past lectures, as well as the opportunity to donate to the Robert J. Lampman Memorial Fund are available on this website.
2024 Lampman Memorial Lecture
Insights on Inequality in Education
Susan Dynarski
Patricia Albjerg Graham Professor of Education, Harvard University
The good news: college attendance is on the rise worldwide.
The bad news: class divides in education are also widening.
In this talk, Professor Dynarski explores troubling increases in inequality in educational attainment and achievement. Potential explanations are examined, as well as promising, evidence-based policies to shrink the divide.
Presented Tuesday, April 9, 2024
Katherine Magnuson [00:00:15] Hello, everyone. Thank you for, taking some time to be with us today. My name is Katherine Magnuson. I’m the director of the Institute for Research on Poverty. And we’re thrilled to have you with us for the lecture. As many of you know, Bob Lampman was a distinguished economist and a prominent figure in the field of poverty research. He earned his PhD in economics from the University of Wisconsin in 1956 and was joined the faculty shortly thereafter. IRP and the Lampman family established the lecture series in Bob’s honor after he passed away in 1997. He was well known as the architect of the US War on Poverty. So, I’ll pause and say that again. For all of us who work on issues related to poverty. Bob was the architect of the US War on Poverty. He is near and dear to many colleagues here at UW who have worked with him, and he was the founding director of IRP in the early 60s, who worked tirelessly with federal officials in Washington, DC, to establish IRP as the nation’s original research center into the causes, consequences, and cures for poverty and social inequality. Bob as an engaged, brilliant intellectual and academic. Cared deeply not just about his, scholarship, but about marginalized communities and the people that were affected by the work that he did. He was very engaged politically. And that brings us to our, honoring speaker, Susan Dynarski who is also a towering academic in her own right and an engaged scholar. Sue is a distinguished economist and public policy expert, known for her influential work in the field of education economics. She got her B.A. in Social Studies from Harvard University and her PhD from MIT in economics. Throughout her career, Susan has made significant academic and intellectual contributions to understanding economic factors influencing educational outcomes, particularly in the realm of higher education, which is what she’s here to talk to us about today. But, like Bob, in addition to her scholarly endeavors, Sue is deeply committed to public engagement. She has frequently provided expert testimony to government bodies and issues related to education policy. She has made meaningful and impactful research and policy recommendations. And I know that she’s worked hard at state and national levels. All in an effort to improve educational equity and access for all students. It is a tremendous honor to have her here speaking with us. And I, thank her for her time. So, Susan. Please take it away.
Susan Dynarski [00:03:08] All right, well, thank you. I’m very honored to be. To be the Lampman Speaker. This is a distinguished series. You know, honor the great public scholar. So, thank you for having me here. I’m going to, talk about a bunch of things, all related to inequality, and education and what policy you can do about it. So be ranging most of the focus is going to be on higher education will be ranging around as you’ll see. So, I want to start by with some historical facts about educational attainment. So how many people go to college. How has that changed over time. So here this is data from a paper I did with Martha Bailey, who was then at Michigan. And so this is plotting by year of birth, the share of people who, get a B.A. So for people born, you know, in about 1982, I think 27% of people get a B.A., you’re in some place like Madison, and you think everyone’s got a B.A, and you know, college isn’t worth it anymore because everyone’s got. And it’s just not true. It just we are a highly segregated society, so we have huge, segregation in where people with more education are, and those with less so nationwide, 27%. And this is not conditioning on graduating high school. This is just of a birth cohort. What share has a B.A. Now it’s up to about 31%, 32%. But that’s it’s it’s really, really never much above that. Above that is the share of people who have any exposure to college at all. They went for one year. They went for a semester. They could have gone to community college. They could have gone to a four year institution. They could have gone to a proprietary school. And one thing you can notice is that that has been climbing much faster than that. So we have become and this is has gone even higher. We’ve come pretty darn good. If you look at recent, you know, even more recent cohorts, it’s up even further. We become pretty darn good at getting people in the college. We haven’t, been so good at getting them through college. And so for these cohorts, less than half of those who started college ended up with a B.A. and some got an A.A. Like, say, 4% of the population. Got it. But mostly people. The largest group is those who have some college but no degree. That is the largest chunk of people, adults in, in the labor force. And, you know, this, of course, is not just the both of these are not just driven by post-secondary policy. They’re a function of policy in our high schools and in our elementary and middle schools and in our kindergartens. Right. So you got to graduate from high school to end up in college, and you need to, to get into a four year college, you need to have graduated high school with a certain set of courses. So education policy, all on the pipeline matters for higher education policy, right. There’s a limited role for just what we do at the border, at the at the, at the point at which people are deciding whether to go to college or not. But it’s in each point. Each decision point is an important one. This now is looking at income inequality in college attendance. That was how it had changed over time for the entire population in the US. This is about how it has changed over time. Across cohorts by income group. Okay, so each of these lines is a birth cohort. The lower one or series of birth cohorts, the lower one is people who were born between 1961 and 1964. Right. And the one above it is people born 79, 82. And then each of these four spots are where they were when they were kids in the income distribution, their parents. So where in the income distribution, where their parents were they in the top 25%? The richest 25%. Were they in the bottom 25%, the poorest 25%. And what you can see here, several things right away. It slopes up right. That’s how you can know really quickly which way income’s going. It slopes up, it shifts up because over time, everyone’s becoming more likely to go to college. So we have an intercept shift, and we have, the slope is about the same. Right. So. Right. This fact went up in parallel. But to be clear, we kind of would have thought that between these two cohorts, between these two cohorts are Pell Grants being introduced? Loans getting much more available, a whole bunch of initiatives that we kind of hoped would close that gap. And at best, we can kind of say maybe that’s parallel, but, you know, it’s it might have gotten a little bit steeper. What’s definitely gotten steeper is this this is do you get a B.A.? And again, all of this is not conditioning on whether did you get a high school degree. You know, it’s just on the birth cohort. You know, this is what we see at the end of a lifetime of inequality across income groups. So the low level over there 6% for my I go to 65. So almost in that that cohort and my dad was a high school dropout. My mom didn’t get a college degree, my neighborhood where I grew up in the Boston area in Somerville. I’m a first gen. So that didn’t come up in my in my bio. That’s one of my proudest, where’s where’s Katherine and complain I complain, I complain. Yeah. I also I got an MVP from the Kennedy School. So they’re complaining about that. So I’m like, sort of somewhere between the lowest in the second quartile, 6% of my, of my peers got a B.A. Yet I did not know this at the time, but that’s basically what the numbers look like. That’s gone up to 9%. This is not a thunderous increase right. So not much budging there. But pretty much all of the growth in B.A. is coming from the top end of the, income distribution. Right. So now there is a steeper slope in income, when it comes to actually earning that B.A.. So the inverse of all this is that low income kids are twice as likely to drop out as upper income kids. So it’s a very high dropout rate. And it’s much, much higher among all income kids. They also go to different colleges, different types of colleges, which may play into, this dropout, process. I just said this. So this now is finally conditional on something conditional on entering college. This is your likelihood of completing, and so you can see, that for my cohort, my group is 26% of those who started ended up with a B.A. that’s just gone up to 32%. And at the top, there’s still quite a bit of variation. Not everybody who goes to college, even in the top quartile, ends up getting a B.A. they couldn’t. If we’re going to end up with 22% pay rate, right, it’s it’s or 28%, right. None of the quartiles is 100% getting a B.A. and if there’s there’s other stuff getting going on. So dropout is a big problem. And here I’m driving home. The point that the problem isn’t just it does not just emerge at the moment that, we see people making the decision to go to college or when they face the price of college, for example. So free college tuition would not erase all of the differences I just showed you. This is this kind of gets at this point. This is, the difference in standardized test scores between kids born into the 90th percentile of the income distribution, almost the top versus the 10th percentile, the bottom right. And so then it’s standardized into standard deviation. And so maintain going up, you know, going up from about 6/10 of a standard deviation to about double that. So a doubling in the test score gap. This is this is work from John Reardon. So. And even among those kids in the low income households who manage to get the higher scores, we still do see much lower rates of getting a B.A. So we’ve got 912 different cells here. So what what is this? So this is the B.A. Completion rates. Among those I think that make it at least to eighth grade to be in this this data. On the left we have the lowest SES group socioeconomic status. So think of that as lowest income. Also kind of like lowest education of your parents. Other some other stuff is in there, but it’s pretty much it covers what’s loaded in there. Middle income high income. And then we’ve got what was your score on the standardized test? Same test that everybody everybody took in this particular survey. And so lowest quartile. Highest quartile. So over here you kind of see what you’d expect. You know, highest income group, highest test score 74% of them getting a B.A. And maybe you get over here what you expect. Lowest test score lowest SES 5%. But highest test score for those low six kids. 41% of them are getting a B.A. Which is the same rate. Pretty much same rate as kind of the mediocre high income kids, right? So this suggests that even if you manage to beat the odds as a low income kid and manage to end up with the very high scores, that you still have a lower likelihood of getting to college. And so, there seem to be barriers all along the way in terms of how you, how you, you learn during elementary, secondary high school, how that learning is translated into, completion later on. So what? So I give you all the depressing statistics. Now I get to show you some policies that we actually know to be effective in changing this. This is not all of the policies that would be a big book. I’m just picking out a few. That have been shown with pretty rigorous evidence, to be effective in closing the gaps I just showed you. So first one, controversial, universal screening. So, so, testing all high school students for college entry, having them all take the Act or the SAT. Dozen states do this, Michigan does this, and basically it replaces the tests that kids would otherwise take, in high school, right. Because every state, every, under the federal law, every high, every, high school student in public schools needs to take some sort of standardized test that was established by NCLB. No Child Left Behind is now Essa. So in 12 states and in many districts, they replaced that test with the state of the act. And what we, found using. So Josh Hyman was one of my, students, at University of Michigan. Was he also Jeff Smith students? Jeff Smith, who’s in the econ department, was also what we we shared. We were on committees together with many for many students. And in Michigan, he was the nice guy. So, you know, what this means is that you’re not relying on teacher or parent initiative to make sure that these kids are taking this test. Right? So and this is where I like to bring in my own, a lot of this stuff is informed by my own experiences. We then go on and test a hypothesis that my experiences have generated to see if they’re right and not. But when I was in high school, I went to a little Catholic school and my sisters went to the same little Catholic school, and they went to UMass Boston, which is like the commuter school in Massachusetts. And so I think everyone figured that’s where I was going to go as well. And so, when I wasn’t in the honors track or anything, they, you know, sort of, asked me whether I want to do typing or, and I was like, I’ve got to do Latin, please, and, and and sort of push all the time. And one time I needed to get my, like, my tonsils out. This was junior year, and my mom, being a good mom, called to ask what would be the right day so they would miss as little as possible. And they said, well, we’re giving the PSAT on this date. And she could miss that. This is a bit of gatekeeping. Right. So this was the school itself doing some gatekeeping about who was going to get access to that test. Now, I did manage then the following fall to take the S.A.T., and that’s when I started getting mail from, from from places where I ended up going like, Harvard. But before that, it was nowhere on the radar. In Michigan, everyone takes the test in their junior year of high school. And what, Josh showed with these data, basically, you had one distribution of test scores before it was mandatory, and then you had one where it was mandatory and you could see who appeared, who had been the missing scores. And lots of low income kids had been missing. Lots of low income, high scoring kids were missing. I think we often have an image. Well, it’s just the people who wouldn’t do well, who don’t take the test. That is not what the evidence indicates. The dumb. This is where, like, the dumbest rich kids will take that test. So many of the smartest poor kids will not. Right. And that is a function. That is because we give the test on the weekends in the suburbs. And how do you get there if you don’t have a car, you need a credit card to register to the test in the first place. There is, you know, in theory, you can get waivers, if you’re low income. But you have to somebody has to be in the counselor’s office at the right time to get the waiver, and they have to not be out of waivers. They can run out of waivers, which seems ridiculous to me, like run out of waivers and have to get more sent by carrier pigeon from College Board or something. So there are many little barriers like this that add up to a lot. The way I like to think about it is, you know, if you are, a parent, with a college degree, think of all the things that you do for your teenager, they wouldn’t do if you didn’t do them and how much you nag them about this, that, and then think of somebody who hasn’t, in the process, been through the process of applying to college, going to college. And those parents are missing that experience of learning by doing, learning to understand the financial aid system. No. How many courses should you register for? Should you register early so you can get the good courses? That kind of stuff is knowledge that tends to be passed down, across generations. And so we see a very strong I showed you the relationship between education and income. If you do that by education, in education it’s even tighter. And you see this worldwide, that the parents education is one of the best predictors of the, of the kids education. So, you know, the SAT, and the ACT, our what we have is a standardized test nationwide. Many other countries, they’ve got a state run test of some sort. We don’t, having some sort of test has been shown pretty, extensively to be a way that low income kids can signal, send up a flag when their schools are not supporting them, or when their school doesn’t look like the kind of place that a University of Wisconsin would be looking, or a University of Michigan or Harvard would be looking. It’s a way to, to get yourself out there. So universal screening. This also applies in among young children. So this was a study, in in Florida, about gifted programs for, kids in third grade. And the way it used to run is that David Card and Laura Juliano, did this piece. So there was a district which, like many at first, only kids who were referred by parents and teachers got the gifted testing. And this is pretty typical, actually, that the kids will get the special testing only if the teacher or the parent pushes for it. And you can guess which parents push for this, right? So, what it resulted in was highly, stratified, classes for the gifted students. So what they decided to do was test all of the kids for the program, not rely on teacher parent initiative. Just everybody was going to take it. And again, found that this shrunk income and racial gaps in who was doing the gifted program. And so rule of thumb, if you’re thinking about trying to shift, shift, inequality in education, anything that is going to rely on. Your family, which is disadvantaged by definition. That’s, in your school, which is probably also disadvantaged if you’re relying on that to make it happen. It’s a place where you could probably get some improvement by making it automatic in some way, instead of relying on individual initiative. People are terrible. You know, people don’t don’t sign up for retirement programs. People who have like master’s degrees and work at big investment banks forget to sign up for their 401 K programs. And when the employer makes it automatic instead that you have to opt out rather than opt in. You see like 40 or 50% boost in the share of them saving. So this is not about like individual responsibility or these kids are just not cut out for college or something. This is the human condition, right. And so getting rid of the various frictions, can help, quite a bit. It can’t do everything. You also need money, right, to be spending on the. You know, this is about getting somebody into a gifted program which is expensive to run. Last one was about getting somebody in college, deciding to provide those college slots. So this is not all about making sure the individual does the right thing and makes the right choices. Society has to provide the right choices. Like University of Wisconsin-Madison has provided, for the citizens of the state and the citizens of many other states as well. I hear. Here’s one. The talk. I’m going to, the end the paper. I’m going to I’m going to show you is, evidence that one can simplify the approach program without destroying it. Which is what we’re seeing right now. So yes. Yes. So I have advocated for decades to simplify the financial aid process, you know, sort of shown, with, with just numbers counting things up. Others have run randomized trials. You know, you can, you can predict with pretty good, accuracy whether somebody should get a Pell Grant using, like, the family income and the size of a family. Right. And that will get you pretty much 90% of the way to what you get from what at this time were 120 questions on the Fafsa. Now it’s going down to 40 questions. So I understand I heard from somebody who’s in an admissions office. Part of the way they got the questions down is that first and last name used to be two questions, and now it’s counted as one. So there’s been some cheating, along the way here in counting our victories. So, there was finally, let me let me say this first. So, the aid application, as it has long existed, is more complicated than the 1040. Right. And most people, low income people who qualify for grants that the, the Fafsa gets you eligibility for are filling out the 1040 A or the EZ. So the Fafsa is far more complicated than that, a tax form. And we all complain about how complicated the tax system is. So, you know, you could, in theory, just use tax data to qualify people like when they, you do tax returns, you know, you so you have a dependent, you will be eligible for this much in grants for their college education and proactively, inform people of this. We do this with the tax credits and the tax deductions, which benefits rich people. Right. But for the poor people, we make them go through this application process. This probably sounds familiar. If you know the literature on SNAP and on Medicaid and on every program for for poor people, we have onerous procedures for, for applying for them. So this actually, you know, many there’s just not just me, many, many, many people were advocating for this, over the course of decades. The last thing that Lamar Alexander did while he was Senator and Chair of the Senate Education Committee was passed legislation that simplified the Fafsa. That took it from 120 questions down to, 40 questions or maybe 41, depending on how you’re counting. And what you’re seeing in the paper now is, that process unwinding, blowing up. So, it’s been completely screwed up, and there is a generation of kids who’s going to be harmed by this, particularly the ones who are high school seniors. Right now, anyone who’s already in college at least got aid the previous year, and the aid office can guesstimate. But somebody who’s coming out from high school and there’s no estimate of what their age could be, they still haven’t heard from colleges about how much they can get, except in the case of colleges who decided, okay, we’re just going to make these commitments, you know, we’ll clean it up afterwards. But in general, it’s been, they’ve been following everything to the letter. And if they don’t have the exact data that they need to get it exactly right, they are not sending out aid offers to people. So we’re gonna. We already had lost quite a few, college students through COVID. So community colleges emptied out during COVID, and they have not filled back in again. So we have had a drop in the attendance rate. First time in a long, long time, the attendance rate to college has actually dropped off. Upside is a completion rate for those who stayed in is higher. I guess that’s an upside. So, we’re in a bit of a mess right now. And this is what I was saying about, okay, you’re going to get people into college, you’re going to jump through the various hoops. You’re going to try to make the hoop smaller or get rid of that smaller, bigger. Get rid of hoops. No hoops. And they need to get to college then, which means you need to provide the colleges, right for them to go to. 80% of undergrads go to public institutions. So this is not like some free market process where, you know, people vote with their feet and pick which colleges should survive and which ones should not. And this is not a big, competitive, Garden of Eden. This is public services. Okay. And so this is a public decision how many good public colleges we have. And so our rate of B.A. Attainment, you know, 33% would be a lot higher if we had more University of Wisconsin’s right, as opposed to where many low income kids go, which are often strapped community colleges. So the spending per pupil at community colleges is way below what is spent on you guys here per pupil. This is like the opposite of what happens in K-12. So in K-12 there is like compensatory funding that follows English learners, that follows kids with disabilities to try to boost. That follows poor kids to boost the amount that spent on them. It’s the opposite in higher education. Those with the greatest needs actually get the least money per person. So strengthening public colleges. Keeping tuition low. And in the case of many colleges, I would say free. And it’s not just about price. We tend to think about price constantly. When we think about when we study K-12 education, we’re always talk as scholars are always talking about quality. So how good are these schools in helping students learn? We don’t hear that question nearly as often when people are talking about higher education policy. Everyone’s focused on who’s paying. And the fact is, with public colleges, who’s paying now is the families. It used to be the taxpayers, pretty much paid for public colleges. And the tuition was was very close to zero. So when my sisters went to UMass Boston, their tuition was like 400 bucks for the year. Now inflate that and it’s more like $8,000 or something. But, you know, it’s, which is and it’s actually now more like 14 or 15. Right? So taxpayer support has shrunk enormously for our public institutions. And the cost of providing that education, therefore, is being paid by the individual student in their family. So we used to have an intergenerational pact. You know, this this generation of grown ups will pay for your education, just like we do in K-12. And then when you grow up, you’re going to do the same thing. And we’ll use a tax system to fund, this provision of education. We shifted away from that. And we shifted towards a high price, high sticker price, high end model with the aid coming through that system I just described, which has been destroyed this year. Right. So this means that the people who rely on that high aid are extremely vulnerable when the system doesn’t run right, as it is not doing right now. I predict when we look at the numbers in a few years, we’re going to see that high income, kids saw very little change in their enrollment behavior in college, and we’re going to see an enormous drop off for for low income kids. And we’re going to have this is going to be a cohort, that is going to be visible in our data for decades when we look at our earnings data, right when we, because many people, if they don’t go right out of college, right out of high school, are not going to go and, you know, so a, a, you know, a low income kid, with the single mother who works full time at a service job is not going to take a gap year and then go back to college the next year. That’s not open. That’s an option for those two. And if they go into the workforce, they tend to stay there rather than go back, later on. So we need to find capacity at the public colleges. I prefer to see, because of how messy and horrific the system is, to just actually make tuition free. Up front is places like community colleges in expectation. The community colleges are free for just about everybody who attends them because they are segregated. That’s where low income students go is to the community colleges, just about all of them, once they get their aid or paying zero for tuition. So quit all of the paperwork and shuffling the funds around and just make it zero. For those institutions for profits have become less of a problem in recent years. These are the proprietary schools where we saw so many loan defaults during the recession, where we’ve recently seen, places get shut down, and then people have their loans forgiven because they were sold or goods. The institutions weren’t actually providing education. They had promised they had done false advertising. These institutions are very, countercyclical. So when there’s a recession, people tend to want to go to college rather than be in the workforce. And it’s perfect. That’s what we want them to do as economists. This is like at a time when it’s your labor isn’t worth as much. Go tool up and get more education. We also tend to, however, cut our subsidies to public colleges during those times because the state tax coffers dropped. The states have to run a balanced budget. They’re not allowed to have, they’re not allowed to run a deficit like the feds are allowed to run. So at the same time that people are trying to get into these colleges. Money’s been cut to them. And what we saw during the Great Recession in particular was. Overtaxed institutions that couldn’t provide enough courses. You have to let everybody in the Community College through an open access institution. You can’t control how many people are attending, but you can control how many sections you offer. And they keep you on waitlists, and they can’t get into the class that they need in order to finish their, their degree, for example. And so what a lot of people did have done is go to these for profit institutions. So we’ve got strong evidence that when community colleges are well-funded, that the for profit shrink. Right that they go away. So they are a policy created problem. So if we don’t like them, how much they charge and the loans that they’re, that they’re getting people into, we have a way to make them go away. It just requires spending some money. All right. I’m going to talk about another piece of evidence that has been shown to be effective. In closing income gaps in educational attainment. And this is work that I did with, a set of my students and postdocs at the University of Michigan while I was at Michigan. So I was there for 13 years. I just moved to Harvard in in 21. Maybe the AER had a piece of that, but, this was in partnership with the admissions office at the University of Michigan. They came to me and they said, it’s out there with a big mouth saying lots of things. So, you know, tell us what would be the best policy if you want to get more low income kids to the University of Michigan. This was when the Raj Chetty statistics were just coming out. And all of the institutions, the IDs, the 40 pluses were getting shamed about how few low income kids they had. And so Michigan was feeling the sting of that wanted to do something about it. I went and I briefed them on the research and had a sandwich with them and left, and I thought that was it. But then, the provost called, the budget provost and said, what can we do? Show us, work with us to do something. And we started a partnership. And I said, I will do that if we can evaluate whether it’s working. So that was my condition. But we had I had with Brian Jacob and others built up a data infrastructure in the state of Michigan, where we had longitudinal data on all of the students who came through the K-12 system, including those SAT scores that all the kids take. Right. And then information about whether they were eligible for free and reduced price lunch and information about where they went to college and if they graduated. And so we were able to use those data to launch a program at the University of Michigan and evaluate its impact. So, you know, the background here is, you know, I’ve been telling you about income gaps and college attendance. These gaps are even larger when you look at selected institutions. So when you look at the most selective colleges, the gaps get enormous. Okay. And this is even true if you condition on academic preparation. Kids with the same SAT score, same GPA ones, low income ones, not the low income kids will go to, less selective schools. And you know, it’s seems like a no brainer. But economists want the evidence. Attending a selective college does seem to increase, completion rates. Take a given student with a given set of academic, skills, and achievements. Drop them in an underresourced school, drop them in a school with a lot of resources. I’m saying resourced and selective, kind of interchangeably, because pretty much they are the same thing in terms of identifying schools. You know the least selective schools are the ones with the fewest resources. If you get somebody to a selective college they’re much more likely to graduate, and then the payoff to their degree when they graduate is much higher. So, if we want to reduce inequality, earnings inequality, income inequality, this potentially could be one mechanism is to get more low income kids into the institutions where they’re going to graduate and end up, with a with a solid career. So we went to look at the data in Michigan. So this is a set of students who aren’t who, have a S.A.T. in about the top 15% nationwide, and have a GPA of, like, A maybe a B-plus. Right. So people who basically they’re identified. This was the set of categories was identified by the University of Michigan Ann Arbor is people they would recruit, right? You know, they buy names from the SAT people, and they do so saying, okay, people with this score and this, these grades and then email and stuff. So, you know, this is there’s no big science behind this. This is just who they felt comfortable recruiting without. They didn’t want to send information to everybody because they didn’t want to get people’s hopes up. So this is a set of high achieving students. We’ve got them broken into two groups. The kids who were eligible for subsidized meals while they’re in high school, the low income students and those who are not a non low income students or upper income students, if you want to see it more quickly. And so for to be eligible for the free and reduced price lunch, for a family of four. It’s about at this time it was about 30,000 family income to get free lunch and about 40,000 to get reduced price lunch. Okay, so you can think of this as with the family of four, people 45 and below and people above that, it’s about the median of the, of the income distribution. A little bit, a little bit lower. And we’ve got these students broken up, by where they end up going to college. I know that these are top SAT scores and they have very high GPAs as well. So a lot of them go to college on the left. You see that of the low income students, 84% of them go to college to some college somewhere. There’s still a gap, though. 88% of the upper income kids go to college. Even among this set of highly, achieving students. You still got a gap. And then the gap gets bigger the further you go up the selectivity. Right. So compared. So, here on this, these are these Barron’s categories, which is kind of opaque. But you know, they’re they’re a useful metric. The most competitive at the top where they’re about equal actually 2% of both groups go to those. That’s the Harvards, the Stanford. And so forth. In the next one, highly competitive or above. That’s where Michigan at the University of Michigan, Ann Arbor is in that category. And look at that eight percentage point. Yep. 22% of the high income kids with these skills were going to the University of Michigan. We were able to track everybody who came out of the high schools using nationwide data are going to a school that is at least as competitive as University of Michigan. So that includes the 2% up top as well, because each of these is cumulative. And so each percentage point gap, we decided to go after those students. Right. That missing eight percentage points that students. Now when we went into it people, we had a working group that we got the people across the university to talk about this stuff. Admissions office people, med school policy school. And the very first thing that, came out, largely from the old school folks was, Michigan’s high schools are a mess, and they are not training enough low income students to meet the qualifications for University of Michigan. So we got to go fix the high schools. And so that’s an easy thing for nUiversity Michigan to say. It’s not very helpful, honestly. You know, deal with the problems. They actually do a lot of stuff, pilots and various, and help out in various ways around the state. But a much more direct thing might be who they admit and who they solicit. So this was this was a finding right here, right, that there were so many, high achieving, low income students who were going to, you know, so down here, any college includes community colleges, right. So the difference between this one and this one for the low income kids, 67%, they’re going to a competitive or above it. 17% of these kids are going to a community college. And these were kids who basically were recruited by the University of Michigan. So big differences. And there as an economist, we call that money on the table. These students had done all the preparation that they needed to, but they weren’t going to the University of Michigan, which meets need. It meets 100% of need. So University of Michigan is actually a really cheap place to go for low income students. So this is a set of, you know, if you’re a kid, from Detroit, that’s in southeast. Which hand? Southeast Michigan down here. I hear you guys have attempted at times to be the mitten, but you’re really not. No. Michigan is the mitten. And so down here, southeast Michigan is where University of Michigan, Ann Arbor, Michigan State University, Eastern Michigan University. Washtenaw Community College is is a set of schools that somebody might be choosing between at this time. And each of them, is from one of these categories. There is no, most competitive school in Michigan it’s not a Harvard or Stanford in Michigan. So University of Michigan is the most selective school in the state. And if you look at the cost. So so first of all, here’s the quality differential I was telling you about. The grad rate at University Michigan in Ann Arbor is 91%. Michigan State, you know, which is a well-resourced institution, terrible, basketball team and stuff. But, you know, they they, it drops by 12 percentage points right off the bat, 12 percentage points. And then you go to one of the regionals, and you guys probably know better than me what this would correspond to in the UW system, actually, which institutions as this would correspond to, 41%. So this is a four year institution. And then for the community college, just 15% of those, who enter and end up getting an A.A. Within five, within six years. So huge differences in your likelihood of graduating and conditional after graduating, huge differences in your expected earnings as well. So this choice is rather consequential, right. And there’s a lot of variety. And the interesting thing here because Michigan meets need. So here is where the students that we’re going to end up studying are students with family income 0 to 30 K. Almost all the kids in the sample that we ended up working with, were the free lunch kids, so had the lowest incomes. For them University of Michigan costs $3,200. That’s that’s and that’s all expenses minus grant aid. So that’s living expenses and it’s tuition and it’s books and all the other stuff. So that’s basically either a work study job or you take out a loan, right. If you look at MSU, it’s twice that because they don’t have as much money to give out into institutional aid. Right. This is about whether the institution has deep enough pockets to make this free. Federal and state aid is not sufficient to make a four year institution free, except in very few instances. So it’s up to the institution to have enough money to give out discounts to lower income students to meet the gap at Eastern Michigan University, with the 41% graduation rate, $12,000 out of pocket for the lowest income kids. Right? That’s where the loans come from. But you’d have to be going to local community college to end up with the price about the same. But boy, the outcomes are different, right? So looking at this, we you know, sometimes when you when you run an intervention and you’re pressing people to do one thing versus another, you worry, are we pushing them to do something that’s not going to be good for them. And this is a case in which for these kids, University of Michigan was the most selective best resourced, had the best outcomes and was the cheapest. This is a rarity. But so this set of kids was kind of a this is a no brainer. Okay. So we knew, from previous interventions in research that students face a ton of uncertainty in thinking about college, so students don’t know what I just showed you in terms of the college quality differentials and the cost differentials and surveys show this constantly. And this is even if you learned all rules about federal aid and state aid, you then have to know how much money each institution is putting into scholarships for its students and whether they’re doing the same amount this year as they did last year, or if they’re getting rid of some. So there’s you basically, some of the uncertainty cannot be resolved until you finally get that aid letter. So this is not just about are you doing enough work to get the information. Some of it is just not knowable until you go through the process and the institution gives you a commitment letter. I already complained about the bureaucracy. We’re seeing how terrible it is. And I also already talked about, the importance of support from adults who can be either supportive or gatekeepers, depending on who they are and what they’re doing. So what we did, what we designed together, after looking at that data, going through the Michigan budget, looking at what it was spending on aid at the time, how much the aid was. We designed the HAIL scholarship program. So this was a, early commitment. So before applications go in to colleges in the fall, it’s not that early fall or senior year of high school sent out to a targeted set of kids who have the high test scores and high grades, and were low income that I that I showed you before, commitment of four years of free tuition and fees at the University of Michigan, Ann Arbor. If they got it, it was not guaranteed admission. It was if they got in, it was going to be free tuition and fees. Right. And also had, you know, all sorts of, you know, please apply. It’s I’ll, I’ll show you what it looks like. Actually, it’s just like show you a picture. This is what dropped in people’s mailboxes. This was cardboard, big, glossy. We wanted people to notice that there had been, randomized trials on student aid in the past, many of them on Wisconsin, in fact, in which, evidence indicated that people didn’t even open the letters because they thought they were scams. You know, you get a you get one of those A4 envelopes with the messy typing, and it’s been stamped sideways and you’re just like, toss it. This was intended to look like something that was serious, that somebody had money in the game. In fact, my son was going through the college search process at that time. And yet when when the mail would come, he would sift through it and he was like, oh, they’re serious waiting. But there is some science behind this as well. So not just my anecdotes. So open here. Very. Very. Oh. Alice in Wonderland kind of thing. Here. And immediately blasted in your face for years of free tuition if admitted to the University of Michigan. And it was personalized for each student. So the printer put the student’s name on here, and then it was signed by the then president, of of the university. And, you know, said you’re awesome. You’re academically excellent. We hope you’ll consider coming to the University of Michigan. Blah blah blah. And if you apply, we’re going to give you free tuition and fees, and that’s equal to like 60,000 bucks. And we also sent in and here’s other stuff, again, pushing the free tuition idea. Michigan’s wonderful. So are you. And we also sent a letter to their parents, and we notified the principals of their schools that they were getting this offer. This was to get the adults, to be supporting the process and knowing something about it. Okay. And we piloted it in half of the schools in the state. We chose that half of the schools randomly so that we could compare what went on at those schools to what went on to went on at the rest of the schools. When you pilot, you got to pick something. You want to pilot something that’s big because otherwise you’re gonna crash and burn. See the financial aid system right now. Right. So piloting and this is a good way if you’re talking with a partner and thinking about doing an evaluation when you say experiment or randomization. People freak out and they think of the Nuremberg trials and all sorts of nasty, you know. And so if you say we’re going to do a pilot. And we’re going to select the set of schools to be in the pilot who are representative of our great state of Michigan, some of which borders Wisconsin. Okay. And, that’s what we did. Right. So we ended up with a representative set of schools. And we did a two year, study, two cohorts of students because we thought we would need that many to be done. Power calculation. Right. And so there’s actually a thousand high schools in the state each year. Only half of them had at least one high achieving low income students. The other half had none. Either the school is fully upper income or it had a lot of low income kids, but none of them met these criteria. So that’s how bad the segregation is, right? So half of them, we had, 2100 students and we split this in half. And then the next year, another cohort, similar numbers split this in half, right? So randomly choose which schools are going to be getting this. And what the treatment is, is getting that packet and the letter to the parent in the letter to the principal. And entire schools were in or out. So if you are a high achieving, low income students at a given school, all the students in that in that who are high achieving, low income, we’re going to get or not get the letter. It wasn’t within schools. Okay, so here’s our mitten. Where are we? Where are we? Here. Somewhere? Right. Here’s a mitten here. Southeast Michigan. This is where Ann Arbor is. All the stuff that I was just describing. These dots are how many of these low income, high achieving kids are in a given zip code. And so you can see a lot of concentration in the Detroit Lansing Flint metro area. This is the Grand Rapids metro area. And then, you know, we got the Upper Peninsula in these these kids in these tiny. This is why we have thousand schools because this is a huge state. And so just like one to the median school in our in our sample had four high achieving low income students in the school and many of them had one. And as you saw from many of them had zero, right. 500 of them had zero. And so the following year, some of those 500 actually had one. And those schools came into the sample and we randomize them. Okay. So the packet goes out in the fall of their senior year. This is fall of 2015. So this is rolling in fall of 2016. And we wanted to know first off when you when you do some sort of an intervention, you want to know if it actually happened. Like do people just throw out the letter and nobody read it or did they read it then like, don’t believe it, you know. No way. So what this was each of the letters had a personalized URL, and if they logged in, they could get a free t shirt. And so the admissions office admissions office started this. They tracked how many people came in. So this is the letter dropping to the students. And this is log ons. This is the letter dropping to the parents. And this is log ons, right? Get that letter from out under your bed. What did they send you? I want to see it right now. And then you see it sort of flat for the for the rest of the time. And then we also saw I. So I learned so much about admissions. They stock these various, bulletin boards and stuff and social media sites. This is College Confidential, right? Where people are very stressed out. Parents and children go and exchange information about college admissions. So this one says, I received mail saying that if I get into UMich, they’ll provide me with the HAIL scholarship, which would cover my tuition. Obviously, I’m not yet admitted, but this is a good sign I might get accepted. I know I sound naive, but I do understand colleges do these gimmicks to get students to apply so they can lower their acceptance rate. This kid isn’t naive. He’s actually quite savvy. There are a lot of, institutions who do do this. They try to blow up their application rate so that their acceptance rate goes down. They go further up in U.S. News and World Report rankings. It’s an important component of those rankings. Michigan doesn’t do that. Michigan was trying to make sure we were not sending out these things to people who had no chance of getting in. But this kid, you know, this is evidence that somebody saw it. So now we’re in, late, September of 2015. I got the same packet and truth be heard, it stress me out. I don’t even think I have the capability to get through the application process. I wasn’t even considering it. But of course now my parents are all gung ho on me going. Get those adults involved, right? I just don’t want them to get their hopes up if I’m denied. And this is something you hear commonly as well. We had one of the. Or my later students. Sociology students knew how to do interviews with people and did interviews with a lot of these students and heard a lot of this, don’t want to get the parent’s hopes up and then find out I didn’t get in or I didn’t get enough aid. And then the parents are faced with saying, no, you can’t go and vice versa, right? So everyone’s sort of like, let’s not get into this. And this was a way to kind of break through that. All right. Let me just show you what happened. So when we counted up all of the applications, among the people who were getting usual and the usual was all of these kids were getting mailings from the University of Michigan. They just weren’t getting the commitment about tuition and all the glossy stuff with pictures of the bell tower and like, Miss Wolverines and yada yada. They were getting all that stuff. Application rate 26% in the control group and 67% among those who were sent the package. So huge effects. Right? So this is this is a near tripling of the application rate. And then they actually had to get in. They got in at about the same rates as other students did. They had about the same admissions rate as the larger student body. And we ended up with in the control group, 12%, percent attending University of Michigan and the treatment group, 27% attending University of Michigan. So each of these each year is a thousand kids. So this is 120 kids. This is 270 kids. So it’s an additional 150 low income kids in the freshman class each year. So this is huge by by the measure, the literature that I talked about this is much, much larger than we had expected. And one thing, that I, you know, we saw these results like, whoa. And then of course, they start worrying again, in my worry was that we were just poaching them all from, like, Madison for Berkeley or Harvard because all I was seeing was the Michigan application in admissions. We didn’t just have the national da- the national data that told us where other people were going. So I didn’t know if we were just poaching people from other really good schools, which would not be that life changing. We got the data and we were not poaching people from. We had no impact at all on the likelihood that people, attended other highly selective institutions. Neither went up nor went down zero. We did, for this 15 percentage point effect that I just showed you. A third was where people who would have gone to a community college instead, so they would have gone to the community college, and they went to the University of Michigan, Ann Arbor, which is one of the top universities in the world. Instead, the remainder were coming from those other less selective four years in the state. So Michigan State, Eastern Michigan University, Northern Michigan University, all the directionals. So that’s that’s where the shift came from. Okay. And so now this is that picture I showed you before. Except now we have. So before we had here’s the upper income kids. Now they’re in gray. The lower income kids in the control group are in yellow. And then the low income kids who got the HAIL packet are in the middle. And so you can see that the middle kids have the gap, in competitive or above, for example, is closed. So it help to close about half of the gap in many of these outcomes. It flipped the gap at the, highly competitive and both. Right. If you look at, if you look at the upper income kids, they’re actually going in at a lower rate than our sample is the treatment sample. All right. I can do this in ten minutes. Ten minutes. Okay. All right. So inspired by all this, a couple years later, Michigan introduced something called the Go blue guarantee. When did Bucky Bucks come in? That was like 18 or something. So this is. Wave of. Where’s our expert. Okay. So. Hi! I’lI see you later on. Yeah. So we have research on the book. You got wonderful research on that. On on your program here. This one is not that. So your program here is, based on let me tell you about this one, and then I’ll tell you how it’s different. Okay. So we had a new policy. And they were thinking it was something that would basically replace the HAIL scholarship. It was called the Go Blue guarantee. We’re going to post these these, these slides. Like, I see you furiously writing all of this down. Yeah. So we’re going to. Yeah. So, you can keep furiously writing down if you feel like it. This was intended to kind of do the same thing. That was the goal, except we didn’t design it. This was from a, you know, lots of people at the University of Micihigan care about these goals. And some other office designed their own program and implemented it. So this one was kind of like Bucky, write free tuition and fees for in-state students with income below 65,000. And we had assets. So Bucky does not have an assets test. You call it facilities. This seems obvious, but I can see why you do that. Okay. So, Bucky doesn’t have an asset test, but the Go Blue guarantee does, right. So and this matters because you can sort of quickly figure out your income by looking at your tax return. In fact, it’s AGI that’s used for the BTP at Michigan. The 65,000 is measured by on your Fafsa. Ding ding ding ding ding or on your profile what your summary income measure is adding up AGI plus a whole bunch of other stuff. So not until you filled out that form and got the information back would you know whether you met the income qualification. So it’s not as well designed as BTP is? Okay. Eligibility is determined through the standard financial aid system. And so just like with the existing system, no. Except for HAIL and a few other programs, student doesn’t learn their net price until after they apply, get admitted and get a letter, and they don’t learn whether they’re going to get the Go Blue guarantee until they apply. Get admitted and get a letter that says whether they got it. And so they’re wait, they’re going to the needs process. They’re filling out their Fafsa. This guy knows what they’re going to do. This year with with the blow ups, and after repeated annually, it’s not a four year guarantee. So yours is a four year guarantee as well. And so their hope and expectation was that this was going to replace HAIL would be a scaled up version of HAIL. And this was something that could be advertised. And boy did they advertise it. No big signs. The big bull neon signs outside of, the stadium, the largest one in the world. If you watch football, they were. Which I have to do sometimes now. And I’m married to somebody who watches football. So. Wolverine. And that’s constantly for the Go Blue guarantee, sort of a way to signal we care about low income students. Right. So it’s kind of advertising. Now, we found this isn’t considered this an opportunity to understand HAIL. Right. Because so for a couple of years, the program ran and then they came to us and they said, so, you know, can this basically be replacing HAIL? And so we then decided to we were still scaling up HAIL, adding high schools each year. And so what we did for this particular year, was have three groups, business as usual, a group that got the Go Blue encouragement, that got a mailing that was especially about Go Blue and and sort of explain what it was and how much it was. And then the group that was getting the HAIL thing that we’d already been doing. So now we were going to be able to compare, you know, two things that both say free tuition, free tuition, free tuition, only one of which is actually a commitment of free tuition. The other one is advertising essentially a need based financial aid form based program. And in fact, everybody in our control group is eligible for the Go Blue guarantee. Right there. Just that’s what we call it, encouragement, because everyone is also going to be screened for that, for the Go Blue guarantee. So here’s what they got. They try to make it look the same. Right. The idea was to sort of have it be as encouraging all this stuff. You know, that we’re great. You’re great, would be the same with both of them. Here’s HAIL, here’s Go Blue. The thing is, because Go Blue is dependent on income and assets, and you have to go through a process. They need to leave room for me listing all of the, procedures and, eligibility criteria. And in particular, they’re mentioning income. Our stuff never mentioned income, so it never made salient to the students. Yo. You’re poor. It just said you’re fantastic. And we’re going to give you free tuition and fees by necessity, because this was dependent on filling out the aid form and showing what your income was. This program did talk about income and assets. All right, so, they got that letter I showed you before. There is just one difference between them. Everything was the same. Right? So this is the HAIL. If you apply and are admitted for the fall, we will reward your hard work. We’ll cover full cost of your in-state tuition. And then, on the other side, we can help you with your college costs as we cover the full cost of in-state tuition for in-state students who are admitted to the Ann Arbor campus, and whose families earn incomes of $65,000 or less with 50,000 or less in assets. This is the kind of fine print that makes people distrust. I guarantee this is not a guarantee, right? It is. If you fill out the forms and shown to be eligible, you will get it right. And so the the verbiage had to make that clear. So what were the effects again randomized. So the middle is the application rate for the HAIL students. This is for the control students business as usual. And then this is for the students who got the Go Blue encouragement. So that’s that’s that’s decent to nine percentage point boost. And the likelihood of applying which is pretty large but nowhere near as large as the boost of HAIL. So it affected, HAIL, you know, a moderate effect on applications. About a third of the size of HAIL’s effect. And then when it came to actually enrolling, it had no impact on the market. Right? So this is not a statistically significant difference, 18% versus 17% of the size of the HAIL students. However, did were substantially more likely to enroll at the University of Michigan. So, basically, it was ineffective in getting more students, low income students to the University of Michigan. So why, you know, what do we think the those are both free tuition programs, right? There are a lot of free tuition programs. And the devil’s in the details. So what you know, I described to the Buckey. The BGP has been shown to be effective, right? We have we have an author wave your hand. We have a PhD being minted who has studied this, this program. And, I’m gonna release. How do you pronounce your last name? Okay, so she did a great paper on Buckey, and, showed its effects on, the yield rate for low income students in the state. That was in the details using AGI transparent. And everyone can look at their tax return and see, especially since AGI is based on the year before. Right. You have a complete when you’re applying in 2017 for financial aid. You’re using your 2015 tax form. So it’s all completed. And if you go look at it is my AGI below that. And there’s no asset test. So that’s it. You know if you’re eligible. These other programs. So you know Harvard’s got a free tuition for families under 60 okay. I’m pretty sure that that is based on the Fafsa measure income and not and not AGI. You know, Bernie Sanders and other Democrats embracing free college. They are pushing for tuition to be zero. Which is quite different from the net cost of tuition being zero. After you process the financial aid forms. So all of this, the details matter a lot. And how you design it for whether it’s going to be really effective or completely ineffective. I think this is my last slide. You know, the big picture here, is that design matters. Right. The effective programs are going to increase certainty. And I think we think especially we do further analysis that I didn’t have time to show you today. The second paper that shows that comparison of the Go Blue guarantee to the HAIL, zero seems to matter a lot. So telling somebody tuition’s 100 bucks versus telling them that zero has a much bigger impact than if you say it’s 100 bucks versus 200 bucks. And our standard economic models are like a dollars a dollar. But we’re pretty much been learning that, you know, hey, it’s free. Makes it makes a big difference having an upfront multi-year guarantee. It seems to be a big, root channel through which BGP is affecting, students behavior. There’s the upfront guarantee of four years. Gives you certainty. So how do you do this? You know, you can have a sticker price of zero. And as I said at community colleges this would cost nothing. And you would get back all the money you spent on processing aid forms at these institutions. Right. They’re getting they’re not paying tuition anyway. So don’t keep putting them through the process of reviewing all these. If you ever worked in an office, you know how much paperwork is generated. And how many people are employed there. What we did with HAIL in which anyone could do any state could do, is piggyback on existing means tested programs. So we piggybacked on purple. Purple is means tested. So we knew these kids were low income. State of Washington. Just, passed legislation signed by the governor that it’s big state aid programs, automatically go to kids who got SNAP just, you know, the the food stamp programs while they are, in high school. So automatic qualification. So the key, though, is that any uncertainty about the aid eligibility is on the institutions. Like maybe they’re not SNAP eligible this year. And they got a little I think it’s people don’t tend to move from poverty into like you know what they call Pellionaires that the aid offices call them. Right. We don’t have the kind of mobility in this country. So if you know one year that somebody is poor, they’re likely to be poor the next year as well and be eligible for the maximum aid once again. So you’ve got an awful lot of certainty that you can, you know, you can use. It’s just it’s very small uncertainty for the institution. Like 5% of the HAIL sample didn’t actually end up being eligible for free tuition. 95% of them were. Once they went and did their Fafsas, they all did the Fafsas. 5% were not. For an individual student and family, that uncertainty weighs heavily. And they probably don’t even think it’s 95 five. They think it’s like, you know, 50, 50 or 44 whatever for the institution. That’s small potatoes in general. We think that shifting risk from individuals onto institutions is something that governments do. Right? Because it, it it’s good for social worker. All right. That’s it. Except that I thank the people, our partners who gave us data and made all this stuff happen.
Susan Dynarski [01:06:14] You don’t, a student gets to go first. Tim you’re not going first.
Susan Dynarski [01:06:22] So Tim can go second and find somebody else to go first. Here’s You’re a student. Yes.
Susan Dynarski [01:06:28] A student. Okay.
Susan Dynarski [01:06:31] Okay. All right. Say that with more confidence. Yes.
Audience question 1 – Domonique [01:06:34] Sorry. Yes. So my name is Domonique. I am a master’s in public affairs student. At the LaFollette School. I know I’ve been taking a lot of pictures so I’m so sorry. Your your work has been really important to my, capstone project, especially since my client is in the Madison Metropolitan School District. I bring this up just because, I’m attendng your seminar tonight just because, my client wanted it to, like my my group project to, like, go away from the free reduced price lunge to determine disadvantaged students but um when you brought it up.
Susan Dynarski [01:07:09] But use what instead?
Audience question 1 – Domonique [01:07:11] Like other variables. Like what other methodologies could we figure out? You know, our group has been thinking about using direct certification.
Susan Dynarski [01:07:21] Most of the furple kids are direct certified Michigan. So that’s part of the direct certification is when the state matches up the health and Human Services data up on, you know, food stamps, all the other welfare programs. And that’s mostly how the furple kids are categorized. I don’t care which one it is, as long as it’s not the family having to go get a form, fill it out and have the burden be on them. I think I answered the question, I didn’t let you ask?
Audience question 1 – Domonique [01:07:44] Yeah. You did. Thank you.
Susan Dynarski [01:07:47] Welcome. Welcome to my classes. All right, Tim, get to ask a question.
Audience member 2 [01:07:52] Thank you, Sue. So Hale gets them in the door. How about the next you know
Susan Dynarski [01:08:01] They also graduate
Audience member question 2 – Tim [01:08:06] The persistence is high. They have special efforts to integrate them socioeconomically
Susan Dynarski [01:08:08] They had to do that, you know, so they saw with the first year they actually saw some struggles so they real you know a lot of the institutions um support programs were place based or like ethnic or racial based resources, and they hadn’t before had like first gen poor kids, and that’s what they are, but they don’t have any of the other markers. They quickly got a bunch of programs in place. So what we’re finding, right. We’re working on the paper now. Yeah. We had to wait for the six year graduation data to come because that’s the typical time to degree in the, in the, in the US to a B.A. And, the treatment students are getting their degrees their B.A.’s earlier. And then by year five it appears to be equal. So the control group catches up pretty soon. But the control group, the control group has taken longer so that the treatment group is getting an additional year in the labor market. Right. Which is worth a lot when you add at the beginning of life. And they’re getting, you know, half. But for the, for the treatment group, half of the B.A.’s are from Michigan or more selective. And for the control group, it’s like a quarter are that so faster B.A.’s and from a much more highly resourced institution, the data we have from lots of sources, that’s going to translate into big impacts on earnings and income and home ownership and health and all that other stuff. But we have to wait for time to pass one year each year. Time passes, and that’s how quickly I can get to the long term effects.
Audience member question 2 – Tim [01:09:49] I mean. They’re starting without debt.
Susan Dynarski [01:09:49] Or like 2500 bucks a year. But they’re starting literally without debt. They’ve got the quality of the degree and everything. I mean, this is, I think in 10 years they’re going to look at this. People are going to look at this and say this is a real winner. That’s what I hope, either me or my students.
Audience member question 3 [01:10:16] Hi um. So first thing, I”m pretty sure I was in the control group. So this has been, like, very as I’m sitting here, thinking about oh I did go to an non-competitive four year institution. Hadn’t I gotten that letter I would have gone so, yeah, that’s a little mind blowing. I actually the Go Blue I could have done that too, but I was like no because I got guaranteed funding elsewhere. But, anyway, so I am interested right now I’m studying Michigan reconnect and its effect on adult enrollment.
Susan Dynarski [01:10:47] So this is a program for for adults who have some college experience but didn’t get a degree. And it makes tuition free for them, is that describing it.
Audience member question 3 [01:10:56] It’s actually all adults as long as they don’t already have a degree.
Susan Dynarski [01:10:58] So anyone over 24 who doesn’t have a degree can get free community college. Okay, so that’s what that’s the Michigan Reconnect program is, Whitmer.
Audience member question 3 [01:11:07] So I do just find Michigan really interesting like educationally.
Susan Dynarski [01:11:12] It’s interesting in lots of ways.
Audience member question 3 [01:11:14] Like you said, big state, decentralized, yeah, and how you described it, it sounded like they have a very good system with administrative data and things.
Susan Dynarski [01:11:24] I help to make that happen. So we help to make that happen. So we worked with the states and through funding from the Institute for Education Sciences to build a longitudinal data system. So Brian Jacob and I spent years in meetings with lawyers, don’t have meetings with lawyers because, you know, it took a long time, but it made this data set, which has been incredibly powerful, you know, hundreds of studies have now been written using those data. So it’s it’s proved useful and Wisconsin should do the same thing.
Audience member question 3 [01:11:53] Yeah that was actually my question is do other states do that, that’s very encouraging.
Susan Dynarski [01:11:55] Texas does it. Florida, Massachusetts, Wisconsin’s been kind of lagging on this. The education piece of it.
Audience member question 3 [01:12:03] Well yeah thank you so much. That’s going to be so helpful as I continue and I use that data. Thank you.
Susan Dynarski [01:12:10] Yeah. Go to, you can apply. So MEDC Michigan Education Data Center is where you can do an application to use the data in your research.
Audience member question 4 [01:12:32] Thank you so much this was very insightful. Whats the story of thos 2% students making from both groups poorest and richest and the A list to the most competitive schools
Susan Dynarski [01:12:33] Like who are they?
Audience member question 4 [01:12:35] Or how. What happens that so that they actually make it pretty much equally?
Susan Dynarski [01:12:39] Well, we don’t have any. You know, basically the treatment group and control group were the same on that. Right. So do you say are you asking who are they or?
Audience member question 4 [01:12:48] Or your initial data showed that 2% of the students in each group in Michigan actually made it to Stanford, Harvardand so on.
Susan Dynarski [01:12:55] Yep, yep. That’s the same in this group as well.
Audience member question 4 [01:12:58] And is that this, ability or the ways Harvard, Stanford and others give scholarships how does it equal there and not equal in all others?
Susan Dynarski [01:13:10] The most elite schools have the strongest financial aid programs. So that’s why we’ve been pushing low income kids to go to them. So the Ivys, are about as cheap as you can get for low income students, even when you define low income as like 180,000 and below, as Stanford does. That was sarcasm.
Audience member question 5 [01:13:38] So I was wondering whether you have looked as well and I’m guessing the answer is yes at whether the types of majors the students have. Whether they’ve been changing toward more rigorous more stem type.
Susan Dynarski [01:13:53] So we, what we’ve done so far. So Michigan part of this data system is all the transcripts for the public in the states. So we have all their transcripts and the National Student Clearing House tells you what the major is if they get a B.A. and there’s no impact on STEM versus not STEM so it is not increasing stem. It is not decreasing STEM so many people are concerned that you send a low-income kid to one of these institutions they’re going to be competed out the tougher degrees. One key thing to note here is that these are not marginal students. These students have very strong academic skills. And so when. You compare their S.A.T. scores to the S.A.T. scores of other Michigan students. They are above them. So these are not most of the work that’s been done on what’s the impact on a marginal. Student of going to a higher quality. Institution is based on regression discontinuity analysis, where somebody’s just barely eligible and so you’re getting the experience of the last person to get in. Now our students are also. Kind of, you know. Disadvantaged but not academically. They had strong preparation.
Robert J. Lampman Memorial Fund
A memorial has been established by the Lampman family with the help of the University of Wisconsin Foundation to support this lecture series. The lecture series, organized by IRP in cooperation with the UW–Madison Department of Economics, offers a special opportunity to maintain and nurture interest in poverty research among the academic community and members of the public. Contributions to the fund are welcome, to ensure continuation of the lectures. The Institute can accept donations through a secure online giving form provided by the UW Foundation. The form will be pre-filled with information necessary to direct your gift to the Robert J. Lampman Memorial Fund. For more information on how to contribute to IRP please see Make a Gift.